Starting that stable isotope stuff (finally)
I’m excited to say that I’ve managed to get going on my third chapter’s data collection! We’re planning to use stable isotope analysis (SIA) to explore longer-term, integrative trends in Cape Peninsula caracal feeding ecology. Essentially what this means for me is that I’m spending a lot of time with minuscule pieces of hair (again). Who knew that’s what I would spend the majority of my thesis data collection phase doing?! Good times.
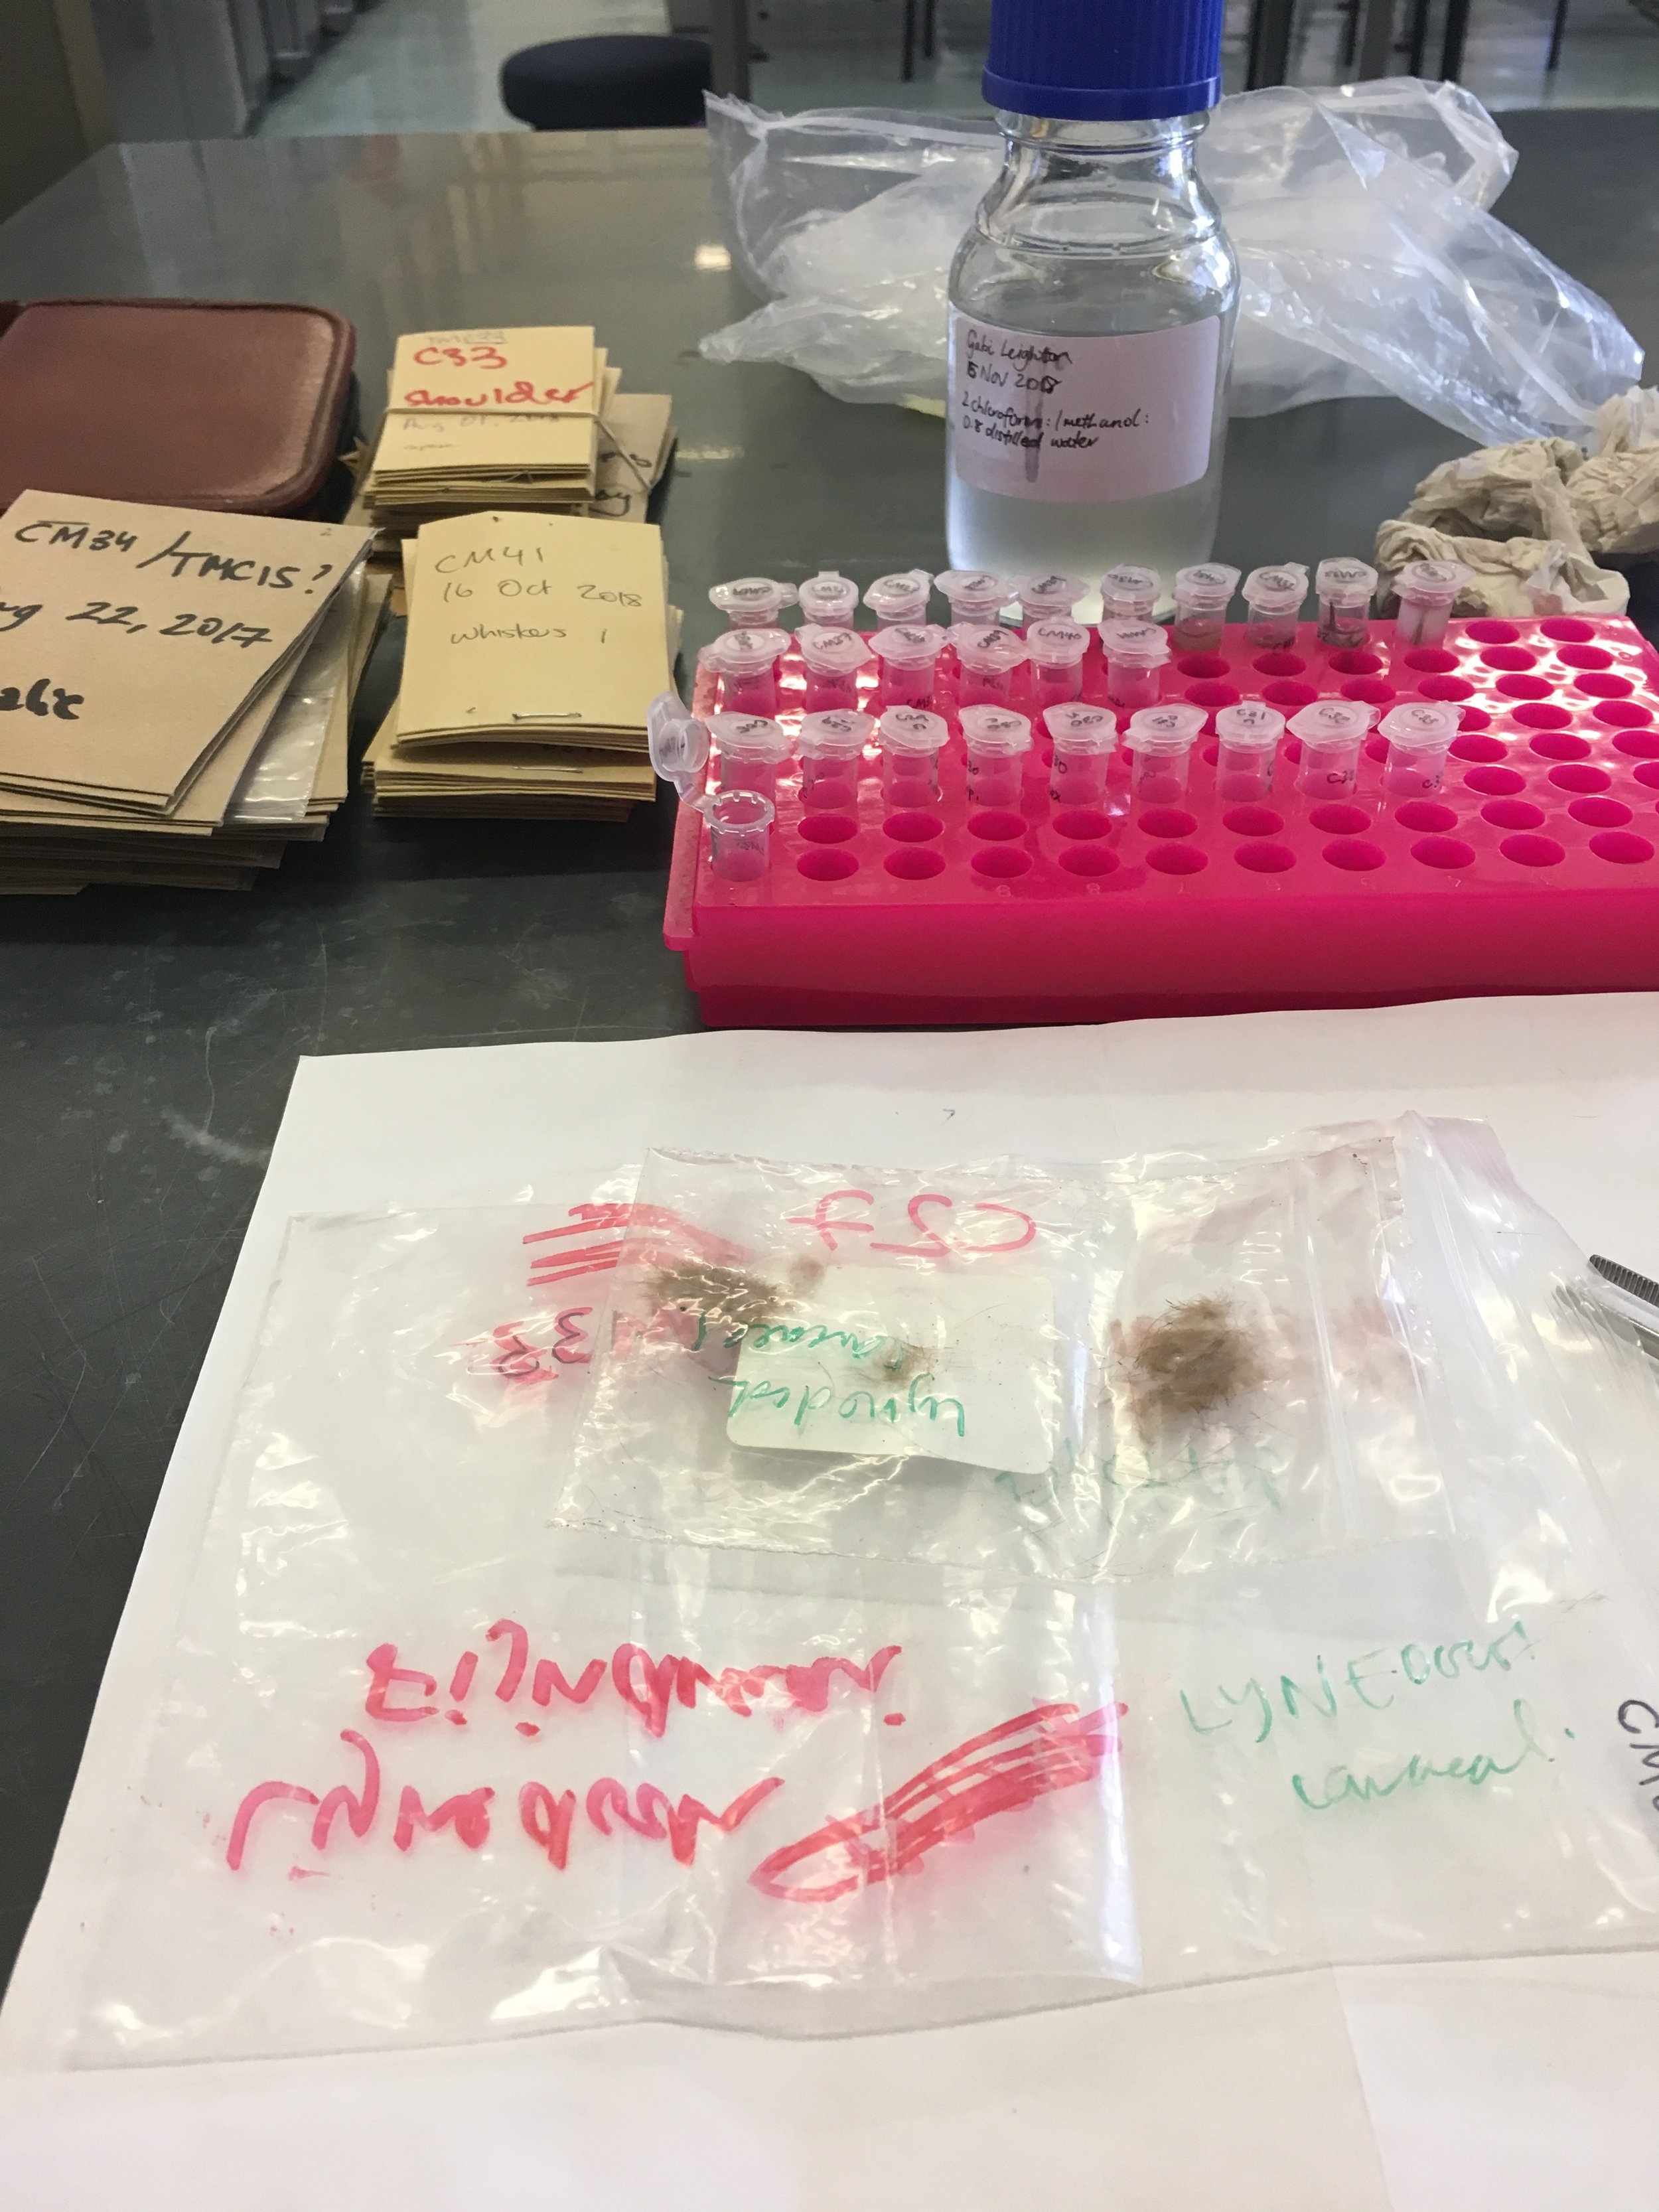
Isotopes are variants of a particular chemical element which differ in neutron number, and therefore have different masses, which makes them useful tools to ecologists. They’ve been used to study diet in lots of different ecosystems, both aquatic and terrestrial. Simply put, carbon isotope ratios can give an indication of the type of plant in the food web (C3 vs C4 – there are mainly C4 plants in urban areas), and nitrogen isotope ratios indicate trophic level (how high up the food web the animal sits). I’d like to look at how this changes over an urbanisation gradient (i.e. north to south on the Cape Peninsula). You can also look at interesting things like niche width and diet overlap between different groups or populations. Anyway, back to the hair… In order to look at foraging I’m analysing the carbon and nitrogen isotope ratios in the hair of caracals (and I’ll do this for their two most common prey items too – Guinea fowl and Otomys or vlei rat). To do this the hair needed to be degreased (i.e. cleaned of any oils and dirt). This required taking a small bunch of hairs from an individual caracal and washing them in an Eppendorf tube with a mixture of chloroform, methanol and distilled water (in a ratio of 2:1:0.8 in case anyone wanted to try it. But always use chloroform in a fume hood. Safety first, kids). Then I removed the solvent and rinsed the hair with distilled water a few times and dried it in an oven.
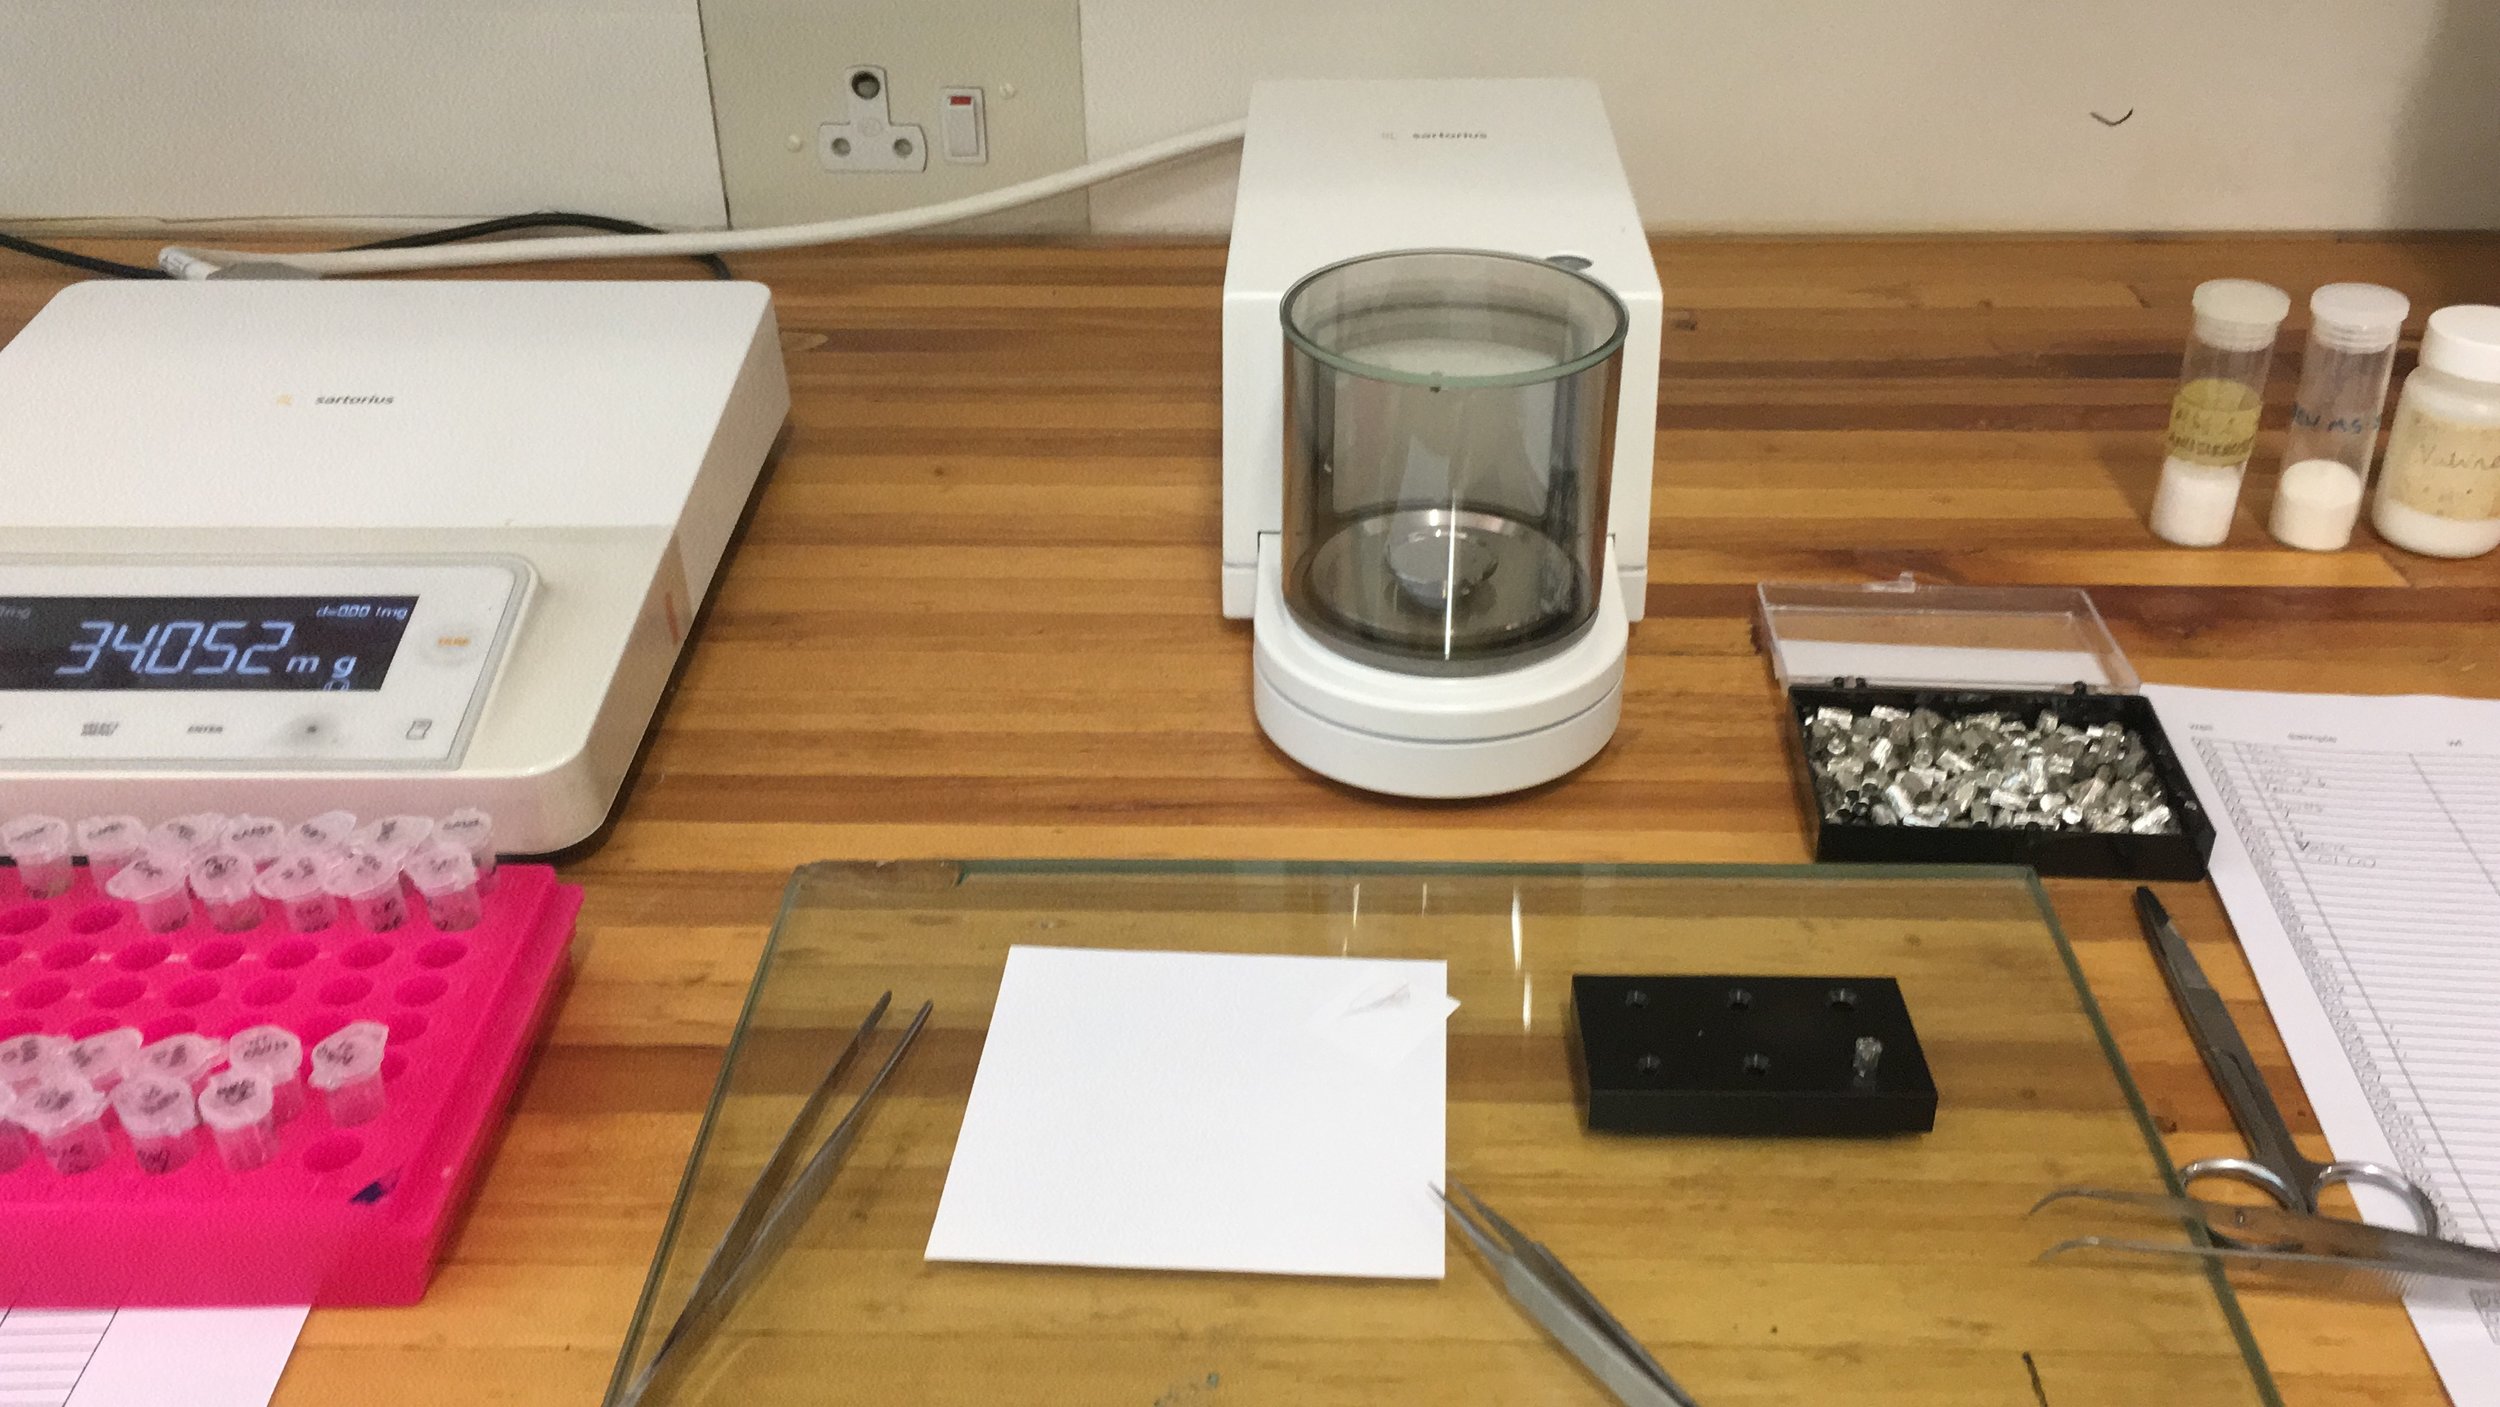
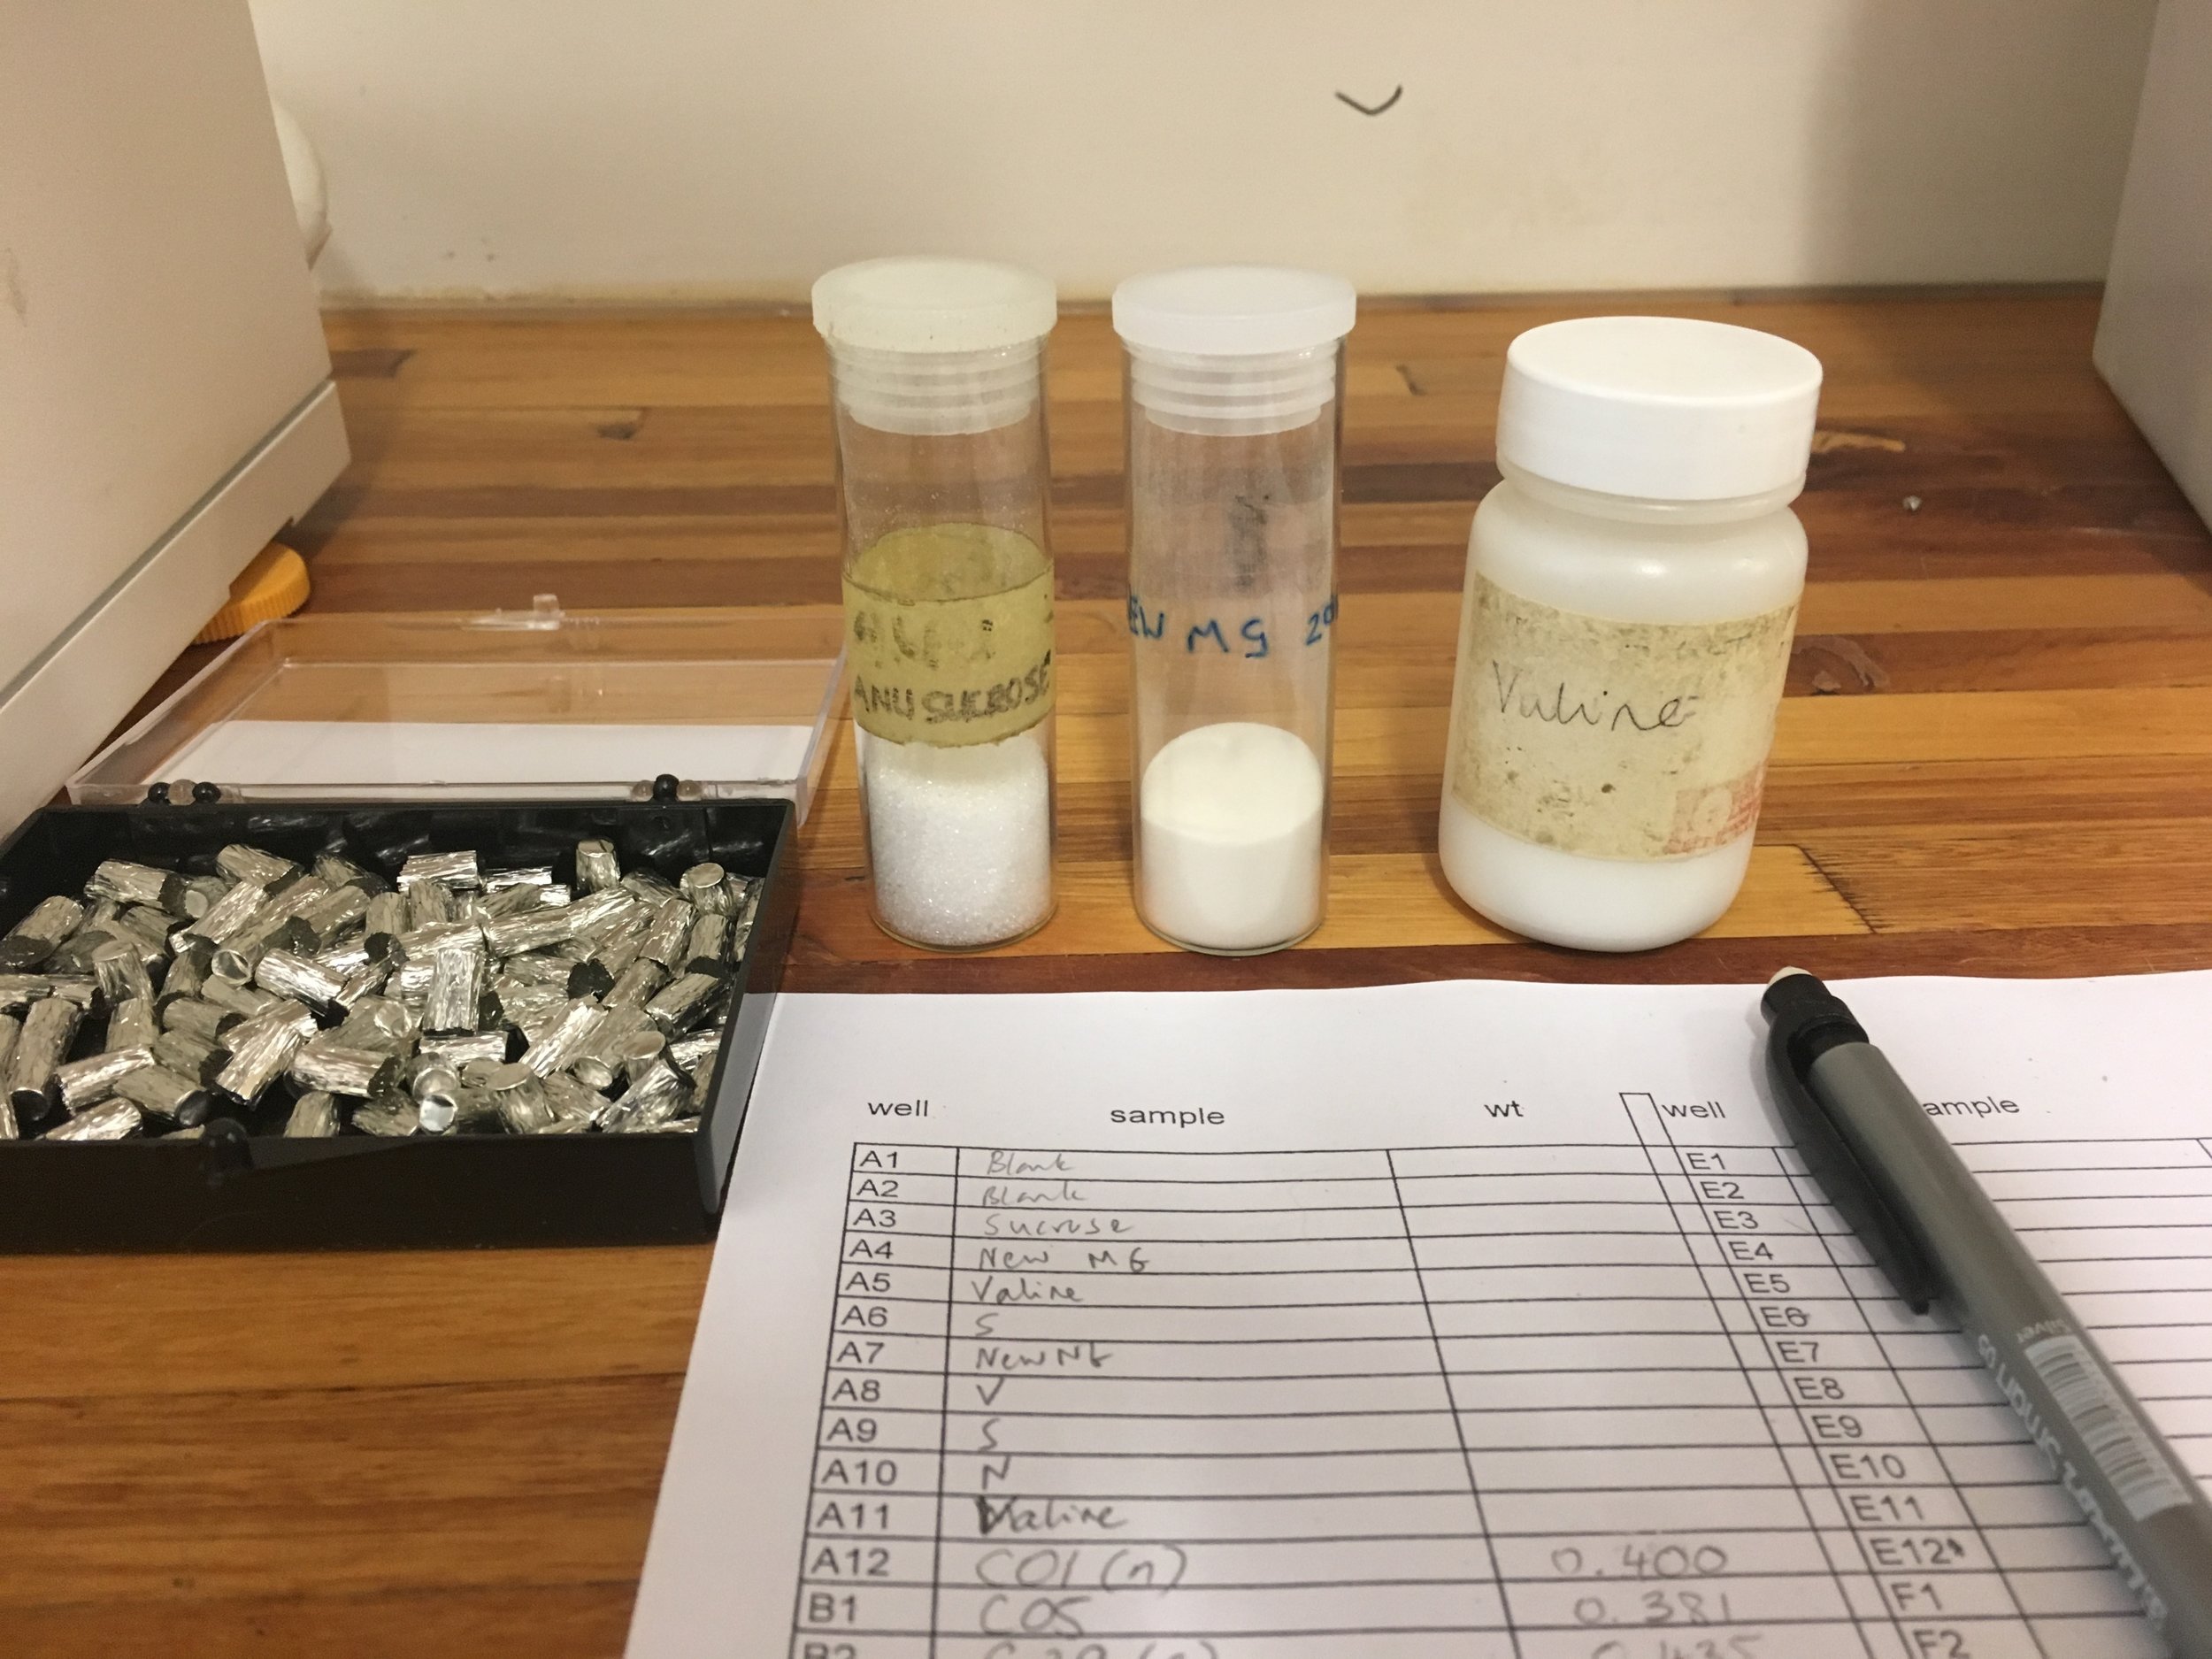
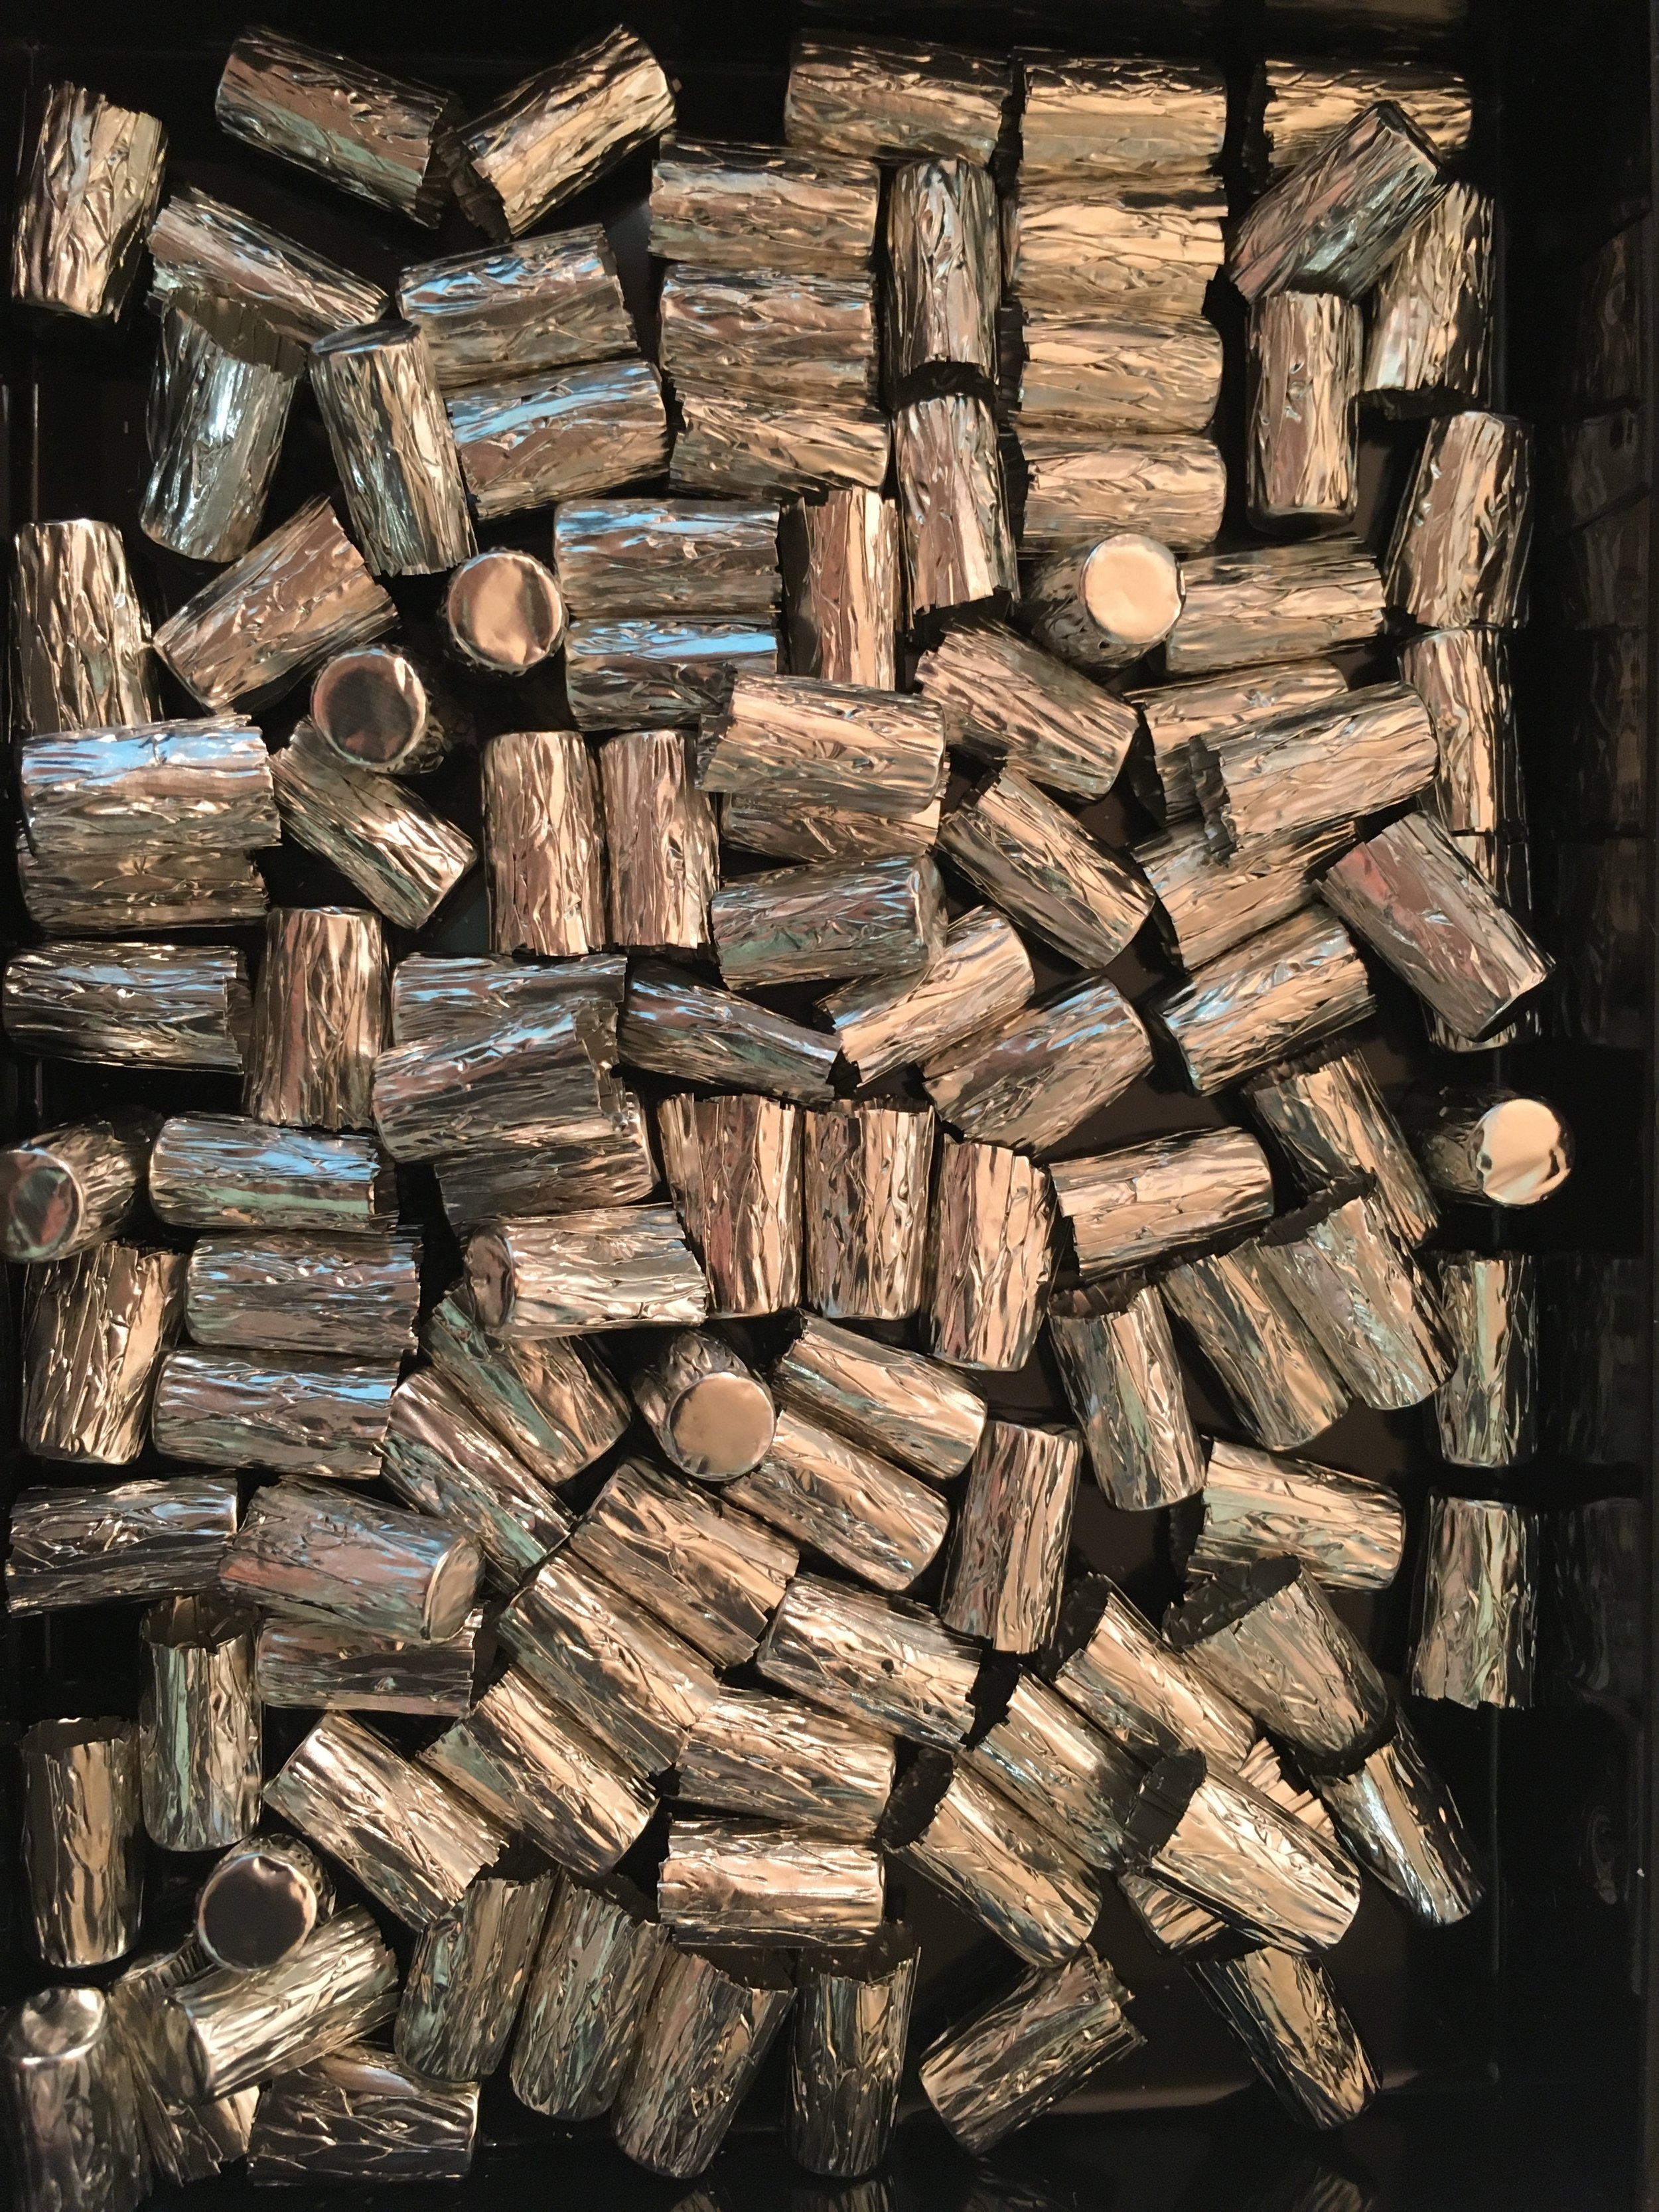
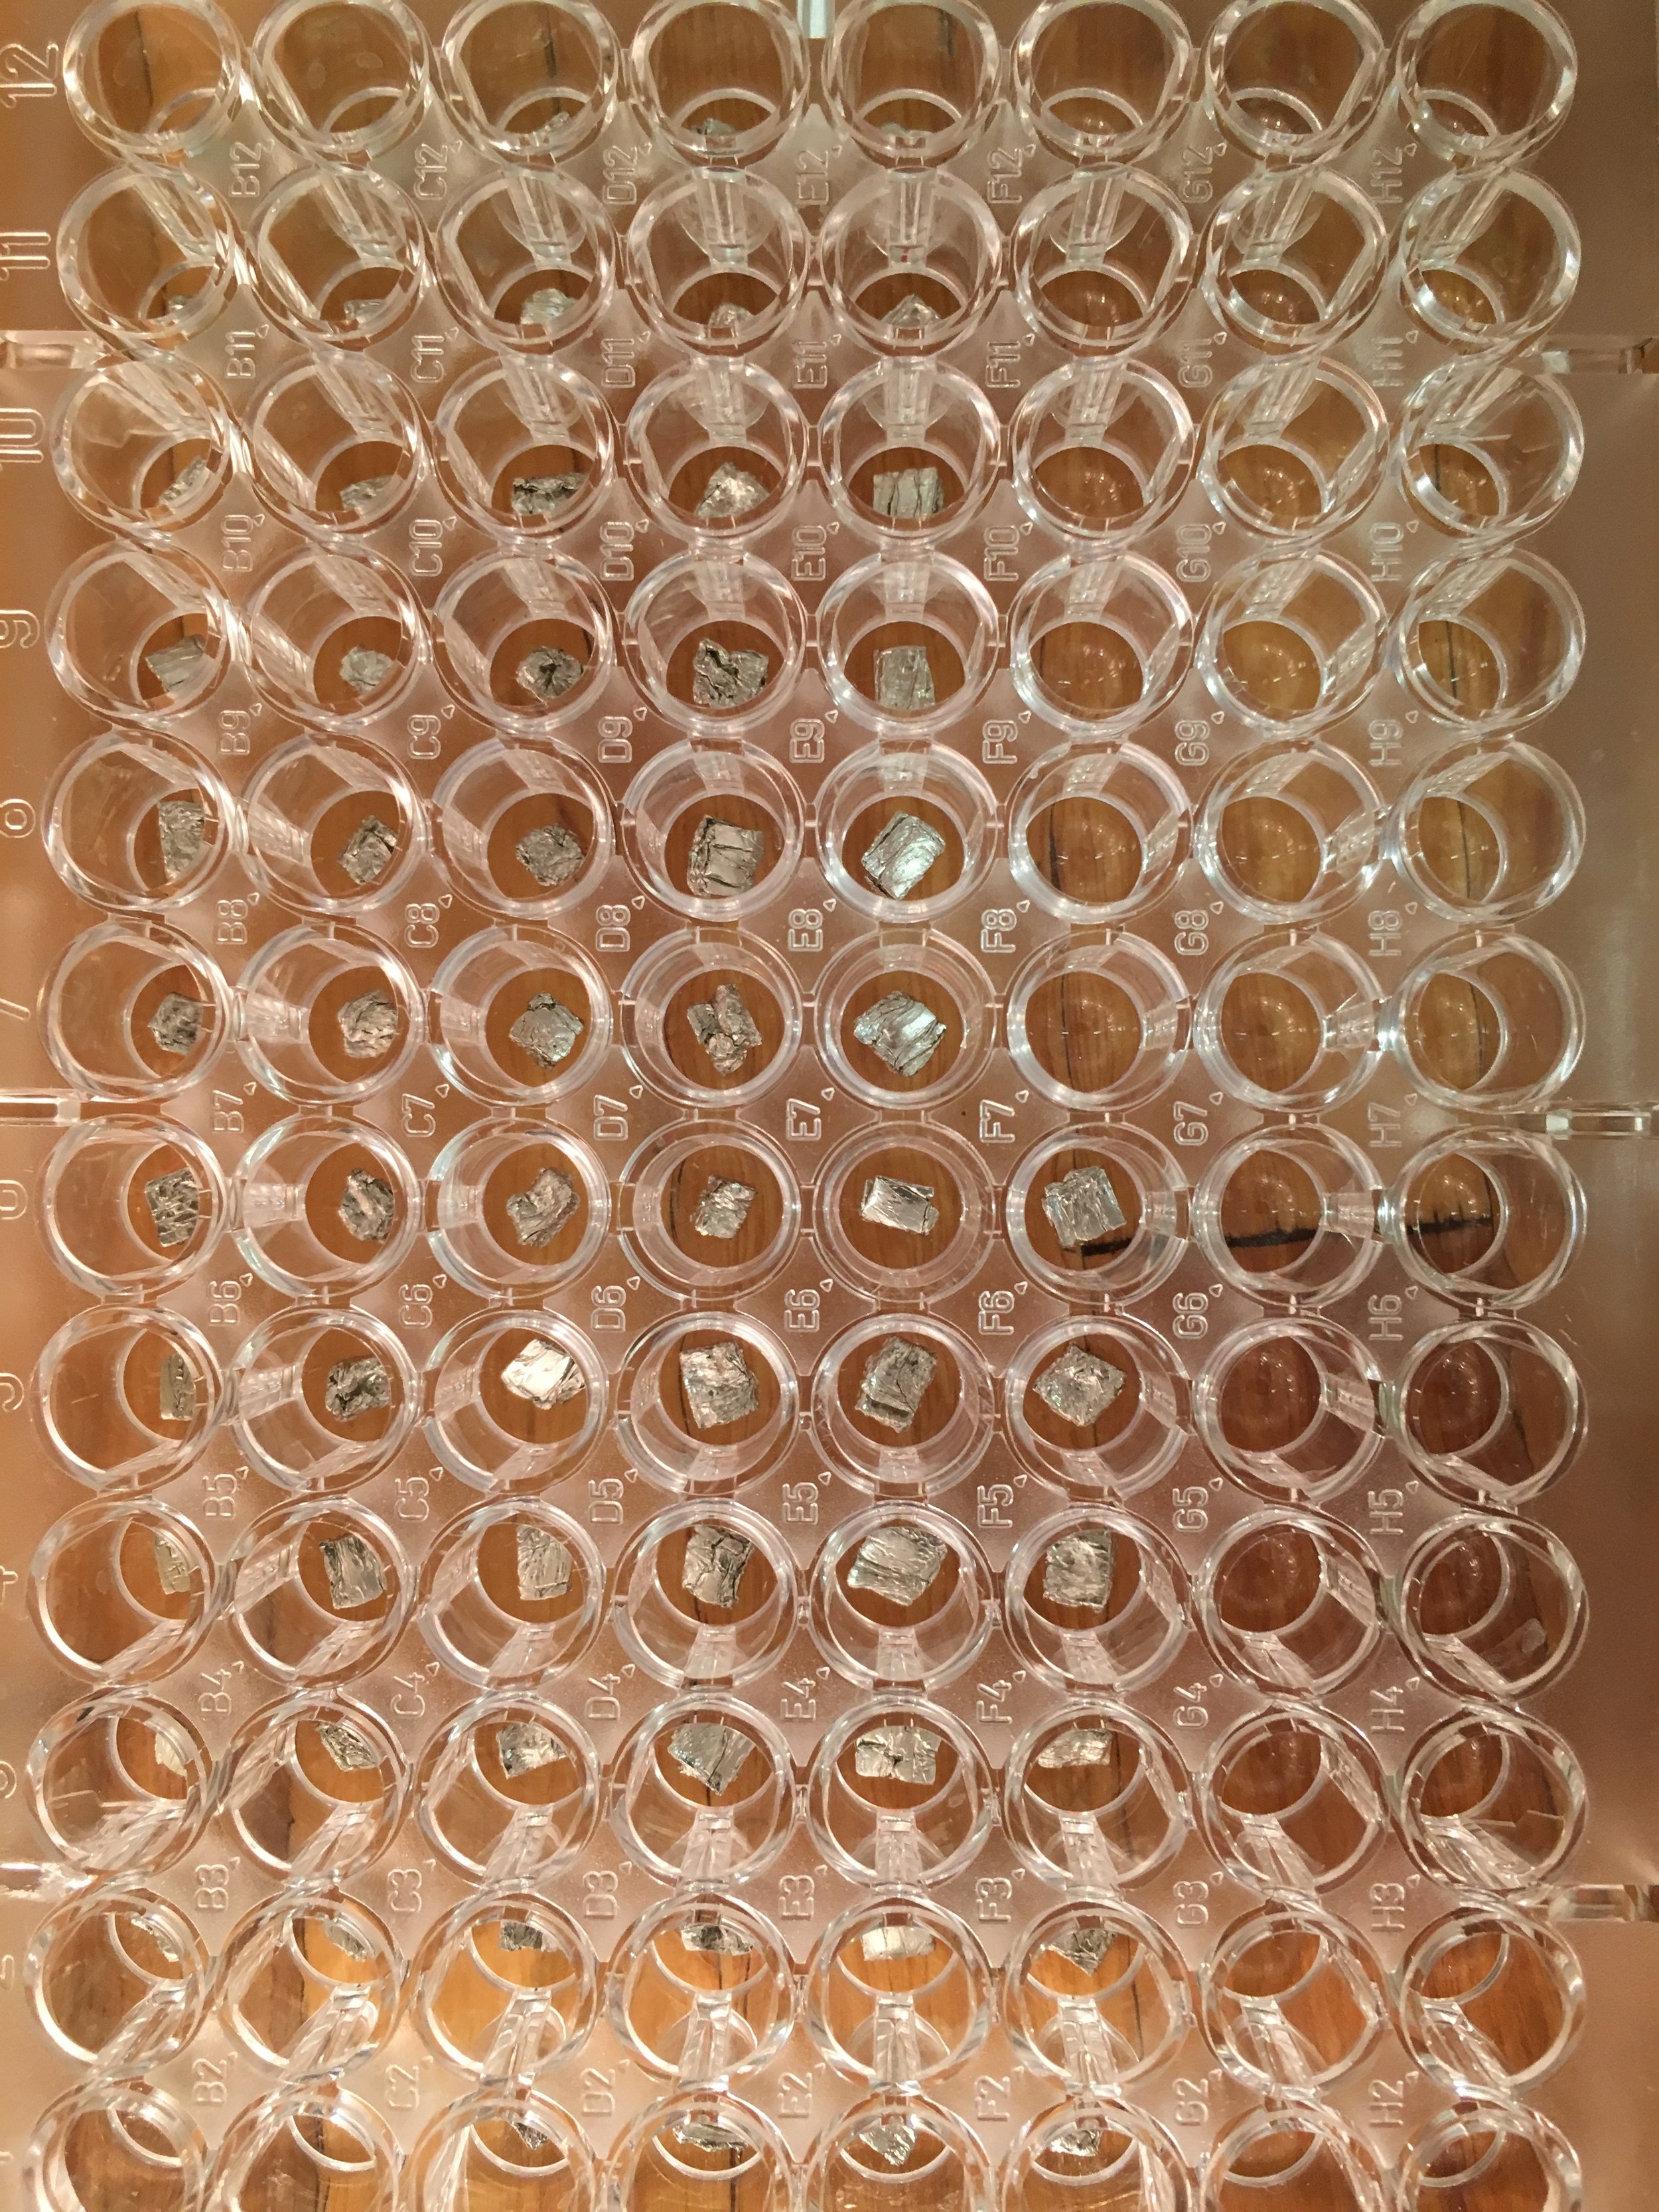
Once dried I then packed up all my nice clean samples and made my way over to the other side of campus to the Archeometry lab were I spent some days measuring tiny, tiny quantities (0.35-0.5mg) of hair into small tin capsules which go into the mass spectrometer (which measures the relative abundance of isotopes in a given sample). Well, the weighing was relatively quick, it was getting the hairs into the capsule and folding it without them flying out that was the time-consuming part. The stable isotope compositions are expressed in terms of delta values (δ) in permil (‰), i.e. parts per thousand differences from a standard. They express the proportion of an isotope that is in a sample. So, in addition to the hair I also had to weigh out the same amount of three standards that are commonly used for hair: sucrose, Merck gel and Valine. I never thought I’d be glad to be measuring out individual sugar grains.
Back in 2016 an Honours student analysed most of the captured caracal samples, so luckily all I had to add to the database was the remaining captures, some mortalities, a few Karoo samples and a bunch of Namaqualand samples. This amounted to 45 samples, which wasn’t too bad. It should be interesting to see the differences between the four populations (Cape Peninsula, the greater Cape Town area, Karoo and Namaqualand) and I’m so tempted to get into playing around with the data. But I better finish writing up my first two chapters first!